







- Estimated waste figures don't hold up in an audit file and can't explain a food cost spike by ingredient or category.
- One measured, ingredient-level dataset can serve both CSRD-ready reporting and F&B cost attribution across every site.
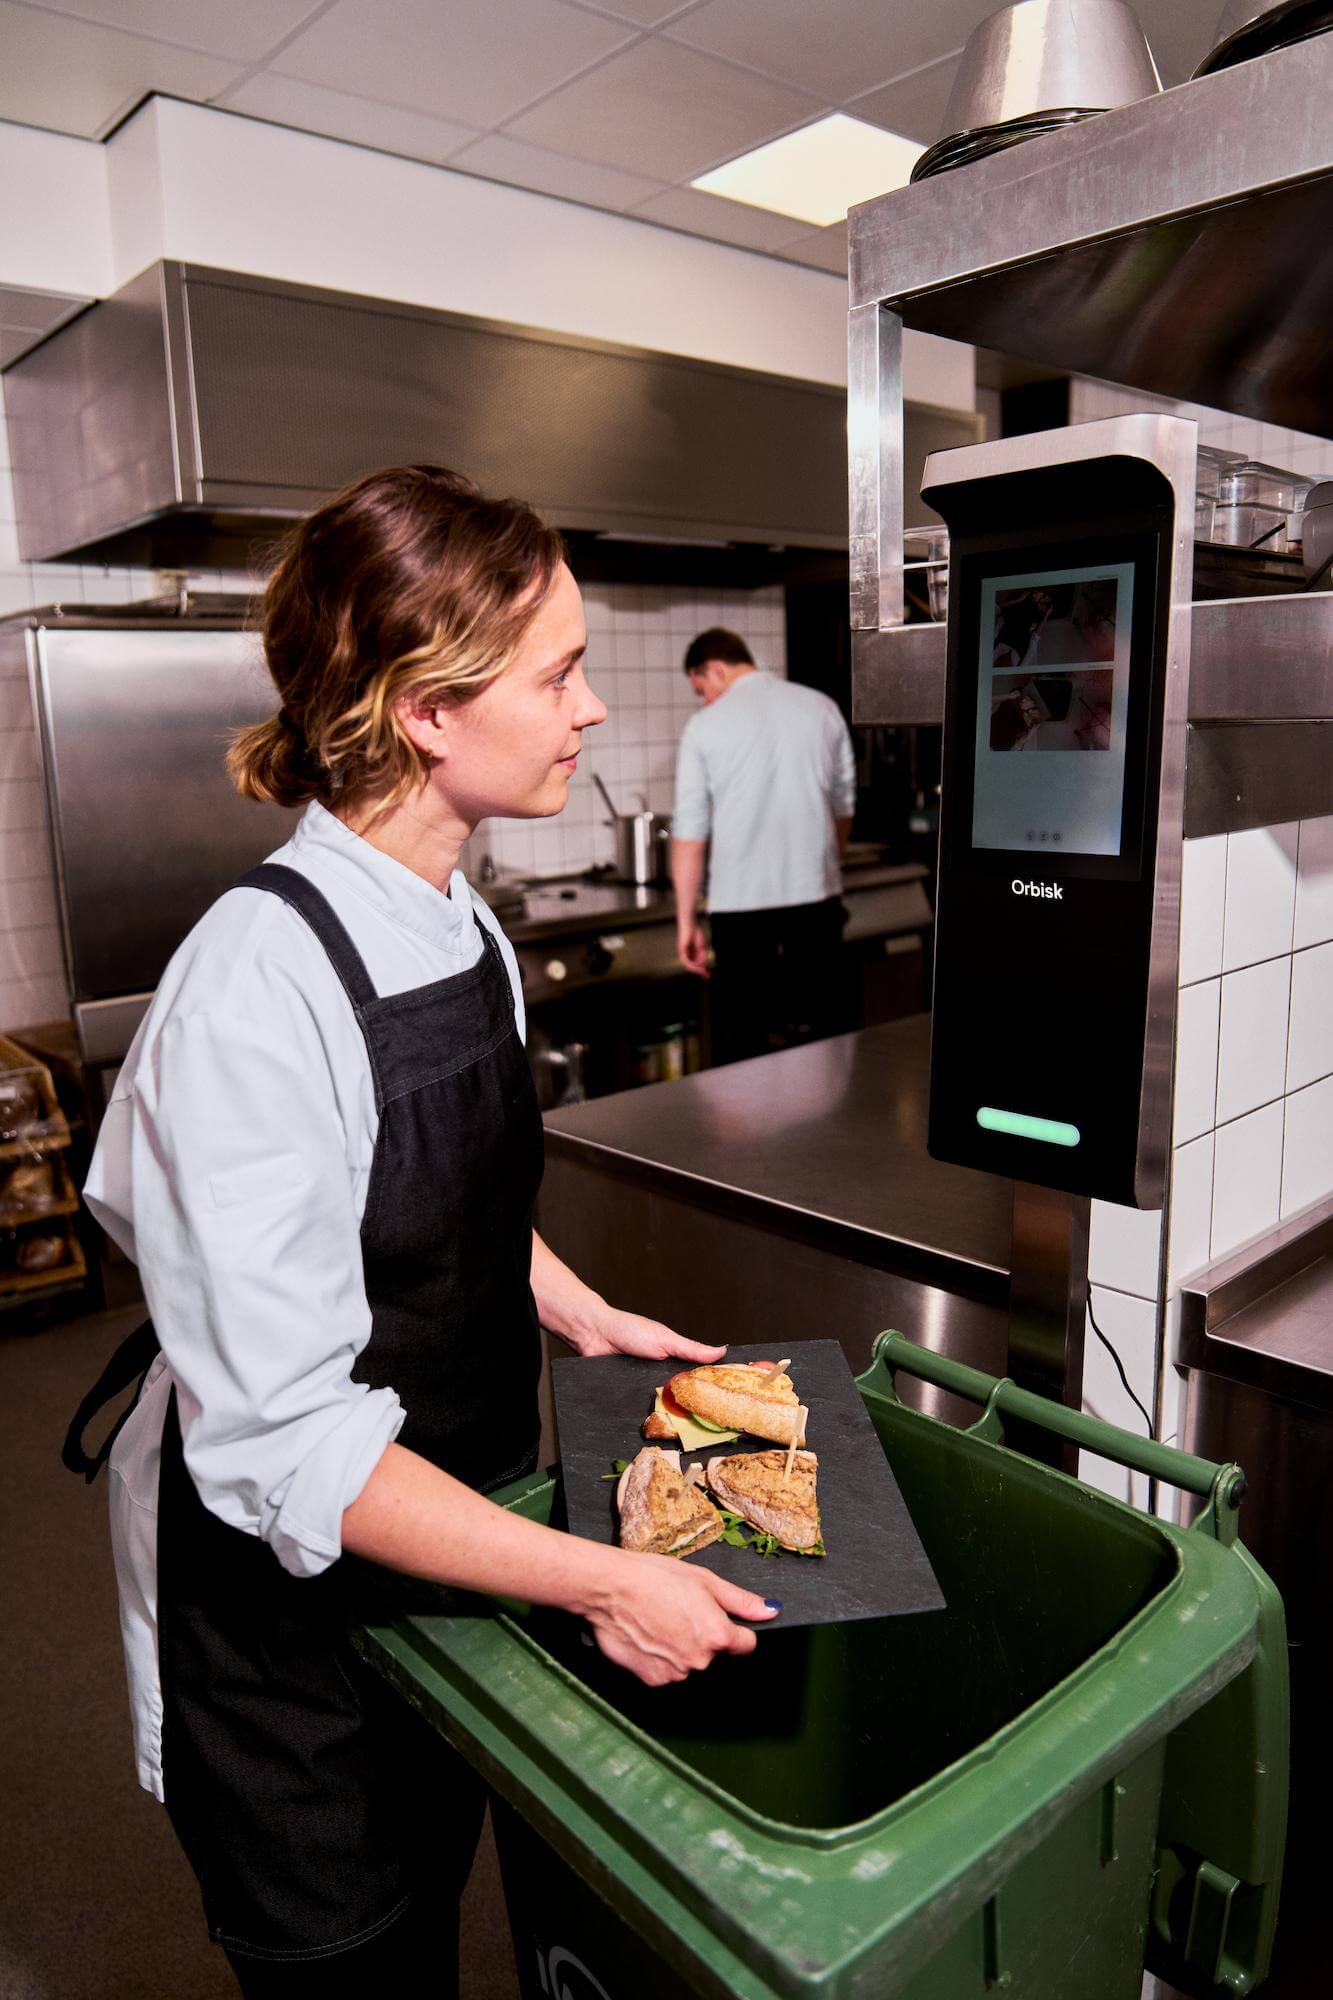
- Every disposal is captured with a photo and its weight at the moment it is thrown away, before anything mixes. The AI imaging system recognises 800+ ingredients with ~90% accuracy.
- Start with a six-week baseline at one site. Orbisk operators report up to 70% waste reduction and ROI within 4 to 8 months, depending on food volume and existing waste levels.
You submit the waste figures. The auditors file them. Meanwhile, your F&B director watches food cost ratios climb, and nobody can say why.
That gap, between what you report and what drives cost, is where sustainable food waste management breaks down for multi-site operations. Kitchens have been flying blind on waste. That is no longer necessary.
Food waste is a measurement problem first. Food waste prevention only works when you know what is being thrown away, where and when. This article shows how kitchens move to measured, ingredient-level data, and what that means for your audit file and your cost case.
How much food is wasted, and where professional kitchens fit
The scale of global food waste explains why auditors, boards and regulators are paying closer attention.
According to the United Nations Environment Programme's Food Waste Index Report 2024, around 1.05 billion tonnes of food were wasted in 2022, roughly 19% of the food available to consumers. Households account for more than half of that total, at around 60%. The food service industry accounts for most of the rest, at roughly 28%, ahead of retail. The Food and Agriculture Organization estimates a further 13% of food produced is lost in the food supply chain between harvest and retail, before it reaches grocery stores or food outlets.
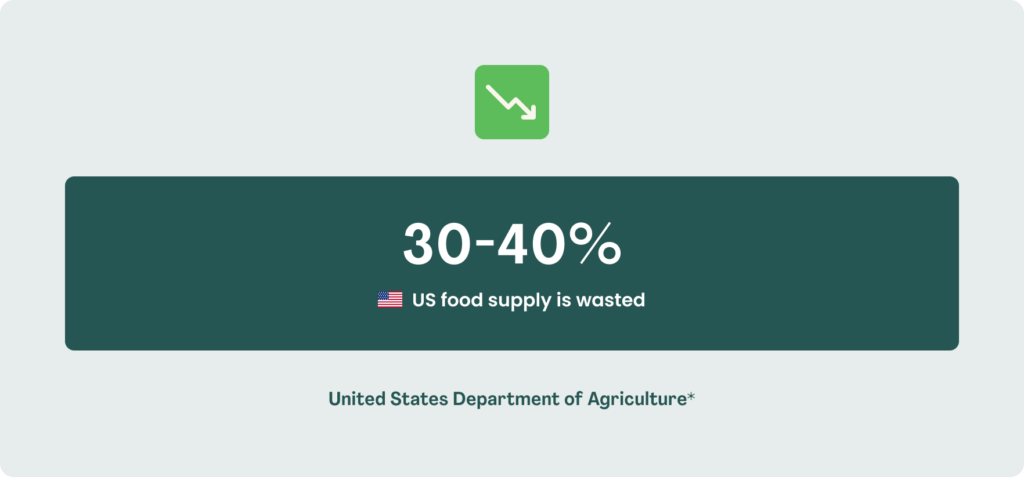
The picture is similar at national level. The United States Department of Agriculture estimates that 30 to 40% of the US food supply is wasted. In the UK, WRAP has estimated that the hospitality sector and food services waste around 1.1 million tonnes of food a year.
Every kilogram wasted in a kitchen carries the emissions of the whole food production chain behind it: farming, processing by food manufacturers, and the energy used to transport food to your door. Food loss and waste together generate an estimated 8 to 10% of global greenhouse gas emissions. That is why halving food waste at retail and consumer level by 2030 is a UN target under the Responsible Consumption and Production goal (SDG 12.3), and why food waste is now treated as a food security issue as well as a cost one.
Prevention comes first in any waste strategy
Sustainable waste management solutions are usually ranked in a hierarchy, from most to least environmental benefit:
- Prevent food waste. Buy, prep and cook only what will be eaten.
- Redistribute surplus food. Food donations of edible excess food to local food banks and charities keep nutritious food in use.
- Animal feed. This tier largely belongs to food manufacturers. In the UK and EU, catering waste cannot legally be used to feed farmed animals.
- Recycle organic waste. Anaerobic digestion turns food scraps into biogas for renewable energy, and its digestate (or compost) returns nutrients that support soil health on farms.
- Disposal. Landfill and incineration come last.
Recycling routes matter, but by the time food waste ends up in an anaerobic digestion plant, you have already paid for it, prepped it and binned it. Prevention is where the cost savings are, and prevention depends on measurement. That is the job of a food waste intelligence platform like Orbisk.
Why sustainable food waste management fails without measured data
Most kitchens don't miss waste targets because the team doesn't care. They miss them because waste isn't attributed to specific ingredients, stations or service moments.
Manual logging breaks under service pressure. Ask a commis chef to stop mid-service and log a tray of salmon trim. It won't happen consistently, because service comes first.
Sites don't share a ground truth. One kitchen logs buffet returns as "overproduction". Another calls the same event "plate waste". Both land in your portfolio report looking comparable, and they aren't.
Reports arrive too late. Monthly summaries tell you what went wrong last fortnight. By then, the same prep volume has already run again.
How measured, ingredient-level capture works
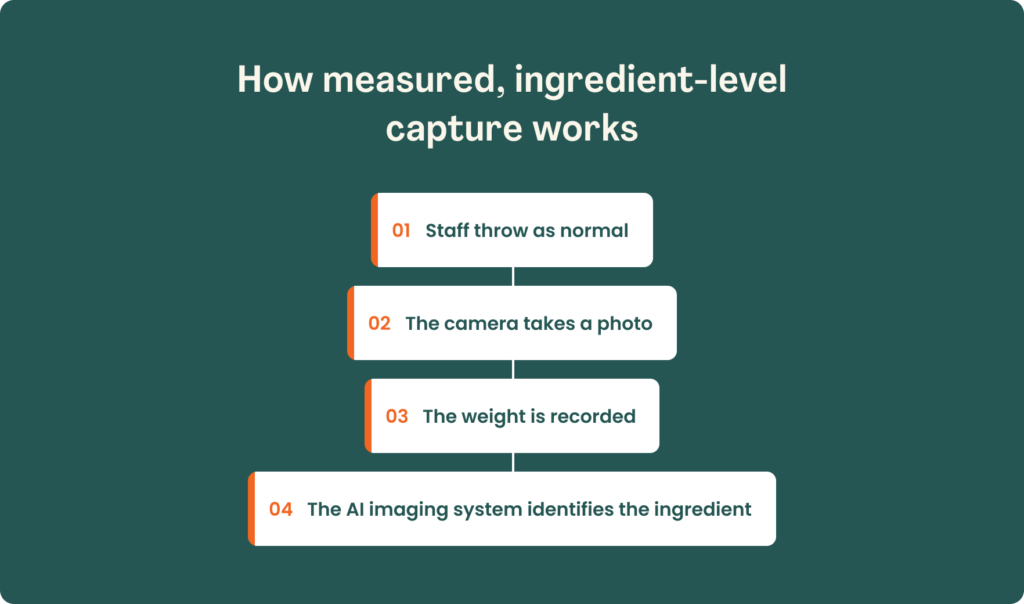
Orbisk is a food waste intelligence platform. It works like an extra pair of eyes in your kitchen. Every time someone throws something away:
- Staff throw as normal. No button, no category to select, no interruption to service.
- The camera takes a photo. Each disposal is captured at the moment it is thrown away, before anything mixes.
- The weight is recorded. The actual number, in grams.
- The AI imaging system identifies the ingredient. Not "vegetable trim". Courgette. Salmon fillet. Brioche roll.
Staff throw. Orbisk captures everything. Orbisk's AI imaging system recognises 800+ ingredients with ~90% accuracy, with zero manual input and zero training.
Because the item is still intact when it is captured, every discard traces back to its ingredient, station and service moment. The same method runs at every location, so benchmarks between kitchens reflect real performance gaps rather than differences in how each team logs.
Three ways measured data cuts waste
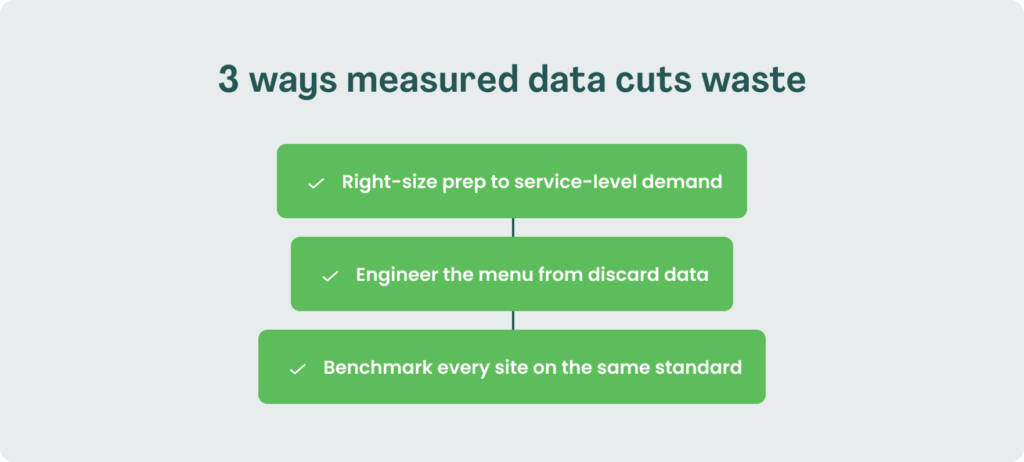
Right-size prep to service-level demand
Waste clusters. The breakfast buffet runs long and salmon goes over. Lunch prep overshoots a quiet Tuesday. Unsold food from grab-and-go counters and multi-outlet operations adds up in the same way.
After a six-week baseline, Orbisk automatically surfaces which ingredients are over-prepared, at which service, and by how much. You approve the adjustment in one click.
Engineer the menu from discard data
Sales data tells you a dish is popular. Discard data tells you it is leaking cost. With top wasted ingredients ranked by weight and cost per category, your chefs can redesign high-waste items or remove high-discard lines. If uneaten food keeps coming back on the same plate, the portion or the garnish is the problem, not the guest.
Benchmark every site on the same standard
When every kitchen is measured the same way, outliers stand out at the first review. A fix proven at one property can roll out to the next. See how multi-property hotel groups apply one standard across every kitchen.
Turning one dataset into two business cases
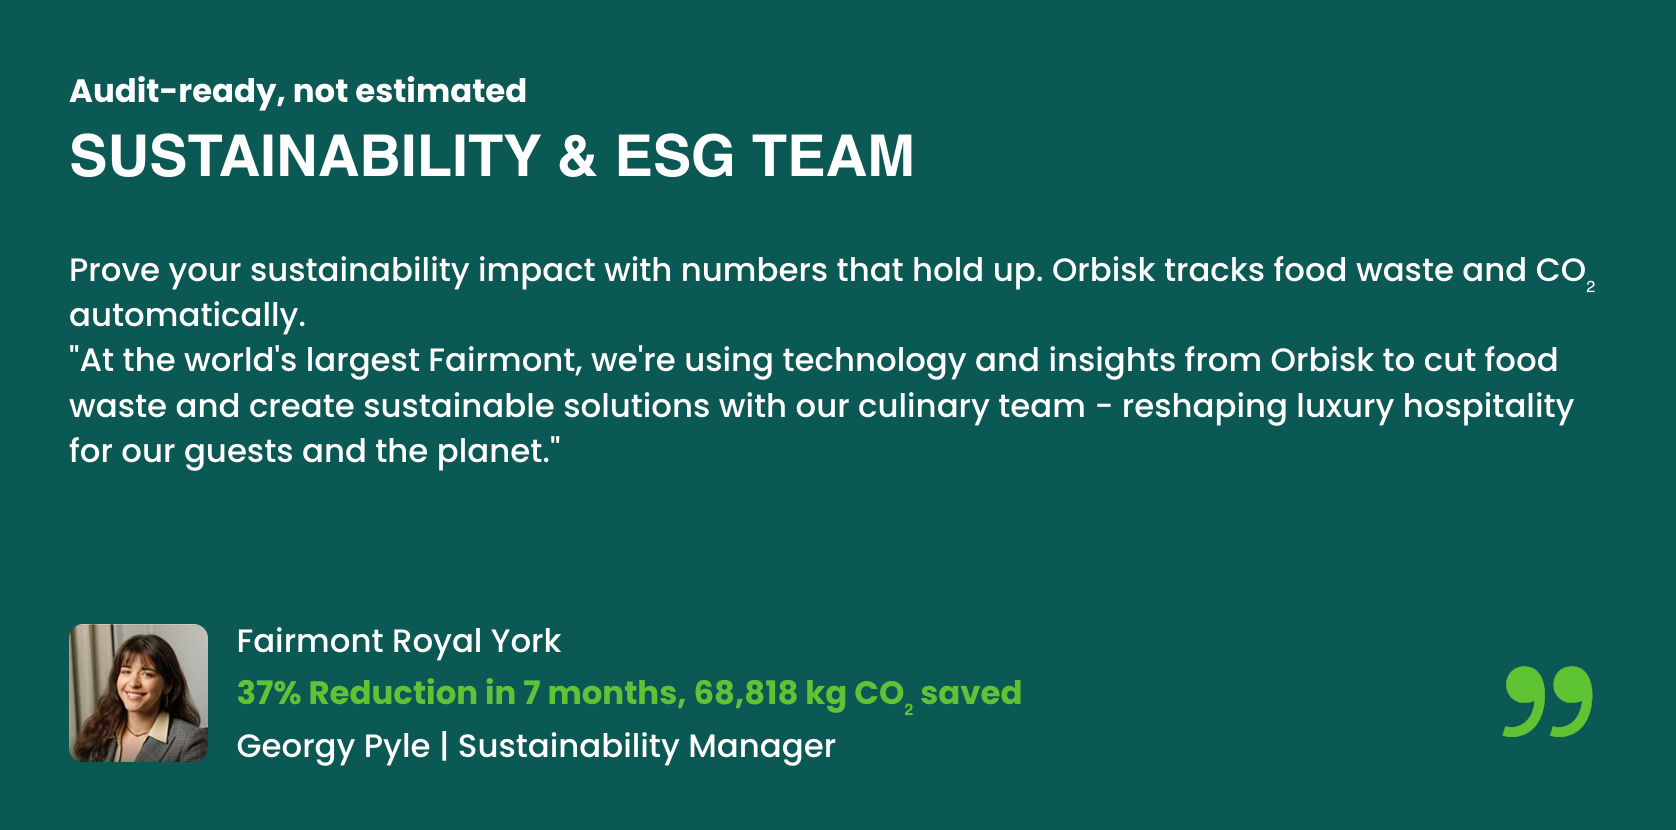
Your waste data has to work for two audiences. One needs numbers that survive an audit. The other needs numbers that explain why food cost moved.
What the audit file needs
If your group reports under CSRD, its sustainability statement is subject to external assurance, so auditors will ask where each waste figure comes from. Recognised food waste quantification methods include direct weighing, waste composition analysis and diaries, and estimates are permitted. But figures built on manual logs or extrapolated weights are harder to trace back to a measured source. Our food waste regulations compliance map sets out what is changing by market.
Orbisk records photo, weight, ingredient, location and meal period for every disposal. That converts into percentage saved versus your baseline, total kg CO₂e and kg CO₂e per guest, in a CSRD-ready, audit-ready format.
What the F&B cost case needs
A category-level write-off ("proteins: over budget") tells finance something went wrong. It doesn't tell the kitchen what to fix.
Take an illustrative scenario. Food cost spikes at one property, and the data points to salmon at the hot section during dinner service. That's one station, in one service window, with cost attributed per ingredient and category. It might be over-ordering, prep running ahead of covers, or spoiled food from stock that wasn't stored properly. Each has a different fix, and only ingredient-level data tells you which one you are dealing with.
The payback case you take to finance
Sustainability alone rarely wins the budget. Payback does. When you take the case to finance, lead with cost savings they can track by location:
- Up to 70% waste reduction, reported by Orbisk operators against a measured baseline.
- ROI within 4 to 8 months, depending on food volume and existing waste levels.
- 2x to 10x ROI on the platform investment.
How Orbisk compares with other approaches to food waste reduction
| Platform | Category | How it captures waste | What the data can attribute | Publicly reported result |
| Orbisk | Capture at the moment of disposal | Camera above the bin records photo and weight as food is thrown away, before it mixes | 800+ ingredients (~90% accuracy), station, service moment | Up to 70% waste reduction |
| Winnow | Above-bin capture | Camera above the bin photographs each disposal and a connected scale weighs it (Throw & Go) | Hundreds of food types (VisionAI product page) | Up to 50% waste reduction, vendor-reported [SOURCE NEEDED: exact Winnow page URL] |
| Kitro | In-bin capture | Camera and scale inside the bin (KITRO TARE) | Named food items, waste type (spoiled, prep, plate), time and station | Up to 60% edible food waste reduction, vendor-reported |
Sources: winnowsolutions.com; kitro.ch/solution.
Reported figures come from different baselines, kitchen types and measurement periods. They are not directly comparable.
What you can compare is where each system captures data and what it publishes about the result. Orbisk and Winnow both capture above the bin; Kitro captures inside it, which depends on each item being registered as it lands, something that is hardest to guarantee when disposal is fastest. Orbisk also publishes both an ingredient count and an accuracy figure, so you can check what the data covers before you commit. Compared with category-level logs, you see 1 kg of salmon wasted at breakfast prep, not 1 kg of "protein".
Leanpath, Foodsight (formerly Positive Carbon), Phood and MetaFoodX also appear on most shortlists, so check their public documentation against the same columns. Inventory management, ordering optimisation and menu engineering tools work differently. They solve a different part of the problem, so they aren't scored here on capture accuracy.
Ingredient-level attribution ties each disposal to a traceable CO₂e figure and a named cost line. That is the difference between numbers you can trace and numbers you have to defend.
How to start: a four-step plan for ESG leads
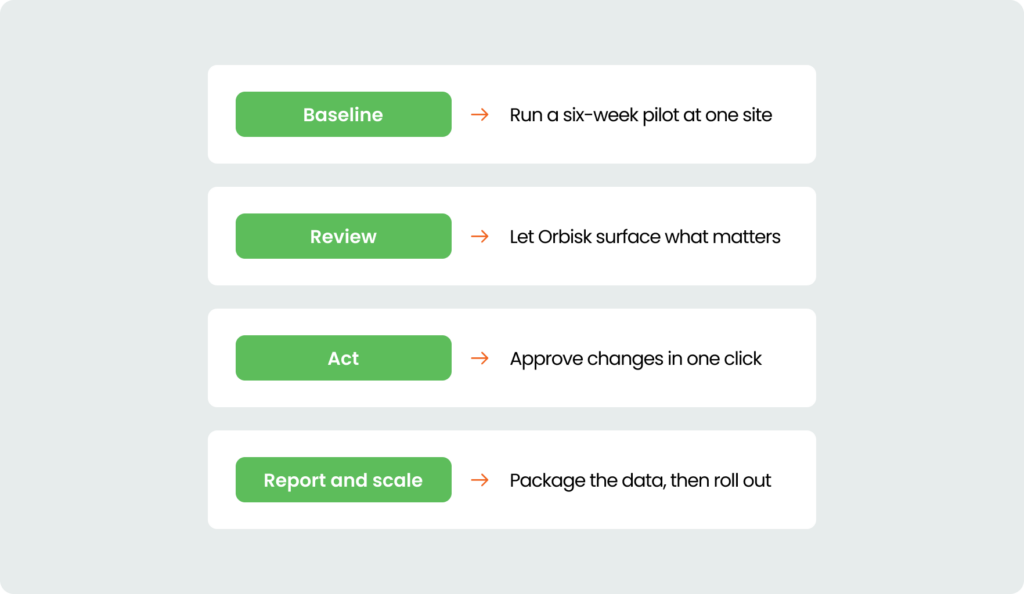
- Baseline: run a six-week pilot at one site. You get measured weights by ingredient, station and meal period, with no staff input.
- Review: let Orbisk surface what matters. Your top wasted ingredients are ranked automatically, with cost and CO₂e attached.
- Act: approve changes in one click. Action suggestions arrive in the dashboard each week, covering prep volumes, purchasing and menu items.
- Report and scale: package the data, then roll out. Take CSRD-ready CO₂e figures into your audit file, then replicate the setup across properties.
Measured, not estimated: how Orbisk gives ESG and F&B one source of truth
Measured, not estimated: that shift lets ESG and F&B work from the same numbers in sustainable food waste management. Today, ESG teams submit CO₂e estimates built on category-level guesses, while F&B directors watch food cost move without explanation.
Orbisk is the food waste intelligence platform that closes that gap. Zero-friction capture at the moment of disposal recognises 800+ ingredients with ~90% accuracy, to the same standard in every kitchen.
See real data from kitchens like yours.
One dataset. No competing spreadsheets. The operators who measure first set the cost and sustainability standard for everyone else.